US Income Inequality Statistics to Know in 2023
Last Updated: March 10, 2023
Income Inequality in the United States: The Wealth Gap
Income Inequality In America: Demographic Disparity
Why is income inequality a problem?
Inequality Statistics: Wealth Inequality by State
Poverty and Wage Stagnation
The Big Five: the Top 1% of the 1%
Wealth Inequality: Trends and Predictions
In Conclusion
Is the wealth gap in America widening?
In a word, yes.
The middle class in America today is worse off than their parents.
We looked at the US income inequality statistics and it’s clear that the gap of wealth is widening at the expense of the middle class. Since 1970, there have been significant shifts in the balance of wealth.
We’ll warm up with some of the latest stats:
US Income Inequality Statistics (Editor’s Choice):
- 41.4% of Americans are classified as low-income or low-income families.
- The top 1% earners make 20 times more than the bottom 90%.
- The 1% have drained $50 trillion from the bottom 90% over the last 45 years.
- From 2000 to 2020, the average salary for workers in America rose only 13.7%.
- Men earn an average of 37% more than women.
- One hundred of the country’s largest private landowners control 42 million acres.
The following charts from the Pew Research Center highlight a worrying trend — while the lower-income groups have remained consistent with their share of the average income, middle-income families have seen their share drop by 19%. The latest statistics show that the COVID-19 pandemic has only exacerbated that tendency.
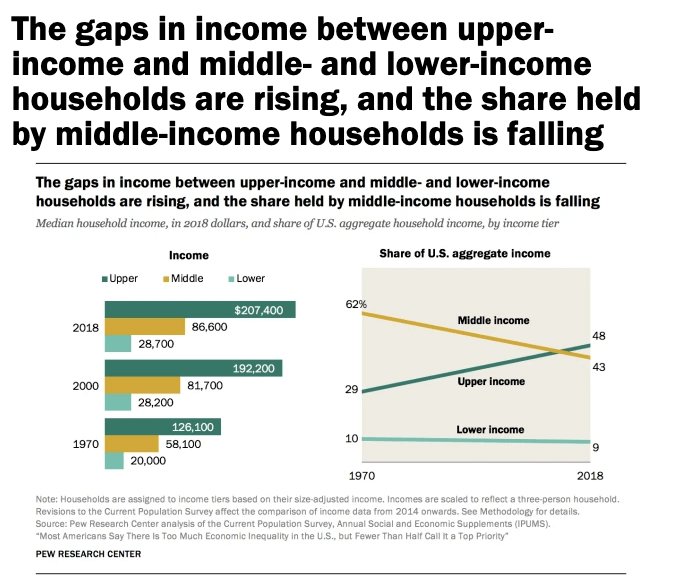
(Image: Pew Research Center)
The only group who’s done well over the last fifty years is the upper-income earners. Inequality statistics show that their share of the average income has increased by 29%. This means that a whopping 48% of income earned stateside goes to upper-income earners.
That raises the question, what, if anything, can we do? It’s a thorny issue. Speak to any of the wealthy 1%, and they’ll say that they worked for the money. At the same time, though, it’s not difficult to grow your wealth when you have the disposable income to do so.
In this article, we’ll go through the latest US income inequality statistics.
We’ll provide the facts and allow you to draw your own conclusions.
Here we go:
Income Inequality in the United States: The Wealth Gap
Let’s take a look at the gap between the highest earners and everyone else:
1. The top 1% of earners make over 20 times as much as the bottom 90%.
(Source: Social Security Online)
The gap between the rich and everyone else seems to be worsening. On average, the 1% earn over 20 times more per year than the bottom 90% of Americans. The disparity grows the higher up the ladder we climb. Even the mid-level one-percenters can’t approach the staggering amounts earned by the ultra-rich.
2. The top 1% own more wealth than the bottom 90% combined.
(Source: Federal Reserve)
When it comes to wealth ownership, one-percenters own more than 90% of Americans. Specifically, the 1% collectively own $43.27 trillion, while the bottom 90% earn $40.28 trillion combined. People in the 90–99% group still own only $50.53 trillion — while this is more than one-percenters as a whole, the group is also nine times larger.
3. To be counted amongst the top 5 percent income earners, you’d have to earn at least $320,096 per year.
(Source: Economic Policy Institute)
This stat further underscores the huge disparity in income. This is around six times higher than the average wage in the country. The top 1% earn more than twice as much at $758,434 and people in the 0.1% group dwarf those numbers by earning $2,888,192 per year.
4. 747 billionaires own two-thirds more than the bottom 50% of US households.
(Source: Forbes)
The bottom 50% own only $3 trillion in wealth, while the US billionaires own over $5 billion. Prior to the pandemic, they only owned as much as the bottom 50%, just shy of $3 trillion.
5. Five richest billionaires own 17% of total billionaire wealth.
(Source: Forbes)
Even the 0.1% have their one-percenters, and income distribution isn’t equal at the top. Five richest billionaires own $897.6 billion, while the remaining $4.36 trillion is distributed among 742 others.
6. Billionaires pay an effective federal income tax rate of 8.2% for the increased value of their stock.
(Source: White House)
Since most of their income comes from the increased value of their investments, billionaires don’t have to pay taxes on the increased wealth unless they sell their stocks, which is then taxed at a rate of 20% (plus NIIT of 3.8%). This is far lower than the 40.8% they’d have to pay if they received the equivalent salary.
However, since they don’t have to sell assets but can take very favorable loans against their wealth, the ultra-rich can get away with paying minimal taxes.
7. The 1% have siphoned away $50 trillion from the bottom 90% since 1975.
(Souce: RAND)
Research by Edwards and Price of the RAND Corporation shows that the US workers’ income has been redistributed upwards at a staggering rate. According to their calculation, without the wealth transfer, the median wage would have been $19,000 higher in 2018, and inequality in America would have been much lower. The only group negatively impacted would have been people in the top 5%, and even then, not by much unless they’re in the top percentile.
8. The top 20% own 63% of the wealth in America.
(Source: The Balance)
The middle classes own just over a third at 36.3%. The low-income group comes in at just 0.62% of assets held. The top quintile owns more than everyone else combined, and the disparity only increases if we look at the top 10% or even the top 1%.
9. 89.7% of shares in America are owned by the wealthiest 10%.
(Source: Federal Reserve)
It’s this disproportionate distribution of shares that could account for the top 10% recovering faster after the sub-prime crisis in 2008. Once the market started recovering, the share prices increased, allowing the investors to recoup their losses. The wealthy tend to have greater equity in terms of shares and assets.
Income Inequality In America: Demographic Disparity
Money and asset ownership don’t tell the whole story. We also need to take a look at who owns the money and are there any identifiable trends.
10. Asian men in America earned the highest average weekly wage at $1,414 in Q3 2021.
(Source: Bureau of Labor Statistics)
This seems to be an anomaly in expected equality and wealth distribution in the US. Most people believe that minorities earn significantly less. The reason for this could be the skill set of these men. Many are employed in fields where a great deal of technical skill is required.
11. Hispanic women in America fared the worst in Q3 2021 in terms of weekly wages.
(Source: Bureau of Labor Statistics)
This is a part of the overall trend. Hispanic or Latino women earned an average of $723 per week in the third quarter of 2021 and are generally the lowest paid demographic. Part of the reason might be the immigration status of some workers.
12. Statistically, Asian American households fared the best, with a median income of $94,903 in 2020.
(Source: United States Census Bureau)
Coming in second were White Americans at $74,912. Hispanic Americans earned an average of $55,321. Black Americans fared the worst with an average income of $45,870.
13. In 2020, men earned an average of 37% more than women.
(Source: United States Census Bureau)
Male and female income disparity is very real. On average, men earned $49,389 per year while women earned $35,838. The gap is narrower but still significant if we only focus on full-time employees. Men employed full-time earned an average of $61,417 as opposed to $50,982.
14. 19.5% of African American families stateside lived below the poverty line in 2020.
(Source: United States Census Bureau)
White Americans fared much better, with only 8.2% living below the poverty line. If we look at this from the point of view of wealth, income and consumption, African Americans are more likely to feel excluded from the economy and become disenfranchised.
15. The poverty rate amongst those aged over 25 years without a high school was 24.7% in 2020.
(Source: United States Census Bureau)
This is the highest poverty rate by educational attainment. The next highest category, people with high school and with no college, are at 13.2%. Education has a significant impact on one’s income as people with some college or at least a bachelor’s degree have significantly lower poverty rates at 8.4% and 4%, respectively.
16. In 2020, around 529,000 workers in the age group of 16-24 earned minimum wage or less.
(Source: Statista)
The minimum wage is still far below a living wage, and an important step towards ending wealth inequality in America is to start addressing the low wages earned by school leavers. Student loan debt statistics show that both college students and graduates are desperate for work to pay off their debt. That’s why they are often willing to work for far lower wages than they should.
By contrast, people from more affluent households have more flexibility when it comes to their options, which further compounds the already existing gap.
Now, let’s ask an important question before we go on:
Why is income inequality a problem?
Studies have shown that the effects of inequality include:
More Social Problems
Those earning lower incomes might feel that they have to resort to crime to support themselves. They might also be more likely to start protest action, such as strikes which have a negative effect on the economy. Human capital inequality is bound to cause resentment towards high-income earners.
More Health Issues
Those in the lower-income groups may not have the money for health insurance. Even if they do have health insurance, they might not want to lose a day’s wages to go off sick. Those without health insurance might miss out on critical care because they can’t afford healthcare. Being unable to work increases the wealth gap even more.
A Reduction in Economic Activity
If 60% of your population is living below the breadline, the economy suffers. Your propensity to spend directly correlates with the amount of disposable income you have. Low-income families don’t have the disposable income to waste money. They’re less likely to buy more than the basics. They’re also not able to afford the education that might help them secure better-paid work.
Reduced Access to Upskilling Opportunities
Citizens who are battling to make ends meet are less able to access programs to upskill themselves. This, in turn, lowers the supply of skilled labor in the country.
Lower Life Expectancy
Economic inequality reduces the overall life expectancy in a country. Low-income families may not have access to enough healthy food. They’re also more likely to suffer from stress. Finally, because they don’t have the same access to healthcare, their life expectancy is reduced.
Reduced Labor Market Flexibility
The workplace has been evolving rapidly, thanks to advances in technology. Employees must learn to adapt in order to survive. Unfortunately, this often means having to be retrained. Low-income earners are less likely to have the resources or the time for this.
The combination of these factors impacts the overall economy. You’re in a situation where employees are walking wounded. In other words, they can’t perform at peak efficiency. The employees are also likely to be less motivated and could be distracted by personal issues. They simply can’t perform at the same level as someone earning a decent wage.
The history of wealth inequality shows that low-income earners are less likely to break the cycle of poverty. Children growing up in these circumstances may perpetuate this cycle because they don’t have the resources to better their circumstances.
Now, let’s move on.
We have more stats coming up:
Inequality Statistics: Wealth Inequality by State
It appears that not all states are created equal.
17. The District of Columbia mandates the highest minimum wage in the country.
(Source: US Department of Labor)
The minimum wage in the District of Columbia is $15 per hour. That’s more than double the federally mandated minimum. Washington comes in second with $13.69, while California and Connecticut share third place with a $13 minimum wage.
By contrast, 17 states mandate the federal minimum wage, and five don’t have any minimum wage regulations at all.
18. Minimum net worth to join Connecticut’s one-percenters is 875.8% higher than the median in the state.
(Source: Windfall)
US income distribution statistics show that Connecticut is the state with staggering wealth disparity. While it doesn’t have nearly the number of millionaires of some of the bigger states, the one-percenters who reside there are fabulously wealthy. It takes $3,603,629 to join that upper echelon, while the median net worth of all Connecticut homeowners is $369,295.
19. Mississippi has the lowest wealth disparity between median and one-percent wealth.
(Source: Windfall)
To join the Mississippi one-percenters, a resident needs to have only $766,205, or 299.6% of the median, which is $191,736. That’s not to say there aren’t any ultra-wealthy people in the state. James and Thomas Duff, owners of Capital Investors, are each worth $1.4 billion.
20. Employees in Connecticut earn more than twice as much as those in Mississippi.
(Source: USA Today)
Income disparity exists both on a state and national level. Mississippi taxpayers earn the least on average ($55,999), while Connecticut ones earn the most ($113,570). This unequal distribution of wealth in America is felt on all levels as, since Mississippi has the lowest wealth disparity, the rich people aren’t as rich as elsewhere.
Poverty and Wage Stagnation
Wage stagnation is one of the leading causes of growing wealth and income inequality. Productivity has soared while wages for the working class haven’t.
21. 27.5% of people in America are classified as low-income.
(Source: United States Census Bureau)
While the official poverty rate in the US is only 11.4%, people earning even twice as much are hardly raking in large amounts of money. They’re still struggling are often making well below the living wage. That means that 89,679,000 Americans are struggling with barely $30,000 in annual income. When you include dependents into the equation, the situation becomes even more dire.
22. The average salary for workers in America rose only 13.7% from 2000 to 2020.
(Source: Federal Reserve Bank of St. Louis)
That’s an average of a meager 0.68% per year. By contrast, the inflation rate averaged out at 2.06% over the same period, meaning that the average salary in the US has not kept pace with inflation, further skewing wealth distribution in the US.
23. 1.1 million Americans work for minimum wage or less.
(Source: Bureau of Labor Statistics)
The current minimum wage has been stuck at $7.25 per hour since 2009. While this varies from state to state, 21 states stick to this minimum hourly wage. Assuming that an employee works a typical 40-hour week, they can expect to earn just $1,160 per month. That’s $13,920 per year or 48% of the average low-income earner’s wage.
24. In 2020, the median income for a household in the United States was $67,521.
(Source: United States Census Bureau)
The median income per household has not changed significantly from the year before. The real median figure showed a decrease of 2.9% in income between 2019 and 2020.
25. The average hourly wage for employees in America in September 2021 was $11.25.
(Source: Statista)
Employees in America earned nine cents less per hour on average between 2020 and 2021. For someone working a standard forty-hour week, that represents a drop of $14.4 per month. That’s not much, but the dropping wages are concerning, and the drop has only recently leveled out.
The Big Five: the Top 1% of the 1%
Let’s compare the richest of the rich with the average joe and jane. We used the median net worth of all Americans ($121,700) and compared just how much richer the richest of the rich are. While they are outliers, this paints a rather stark picture of the unequal distribution of wealth in America.
26. Elon Musk’s net worth is 2.43 million times higher than average.
(Source: Forbes)
Elon Musk, the founder of Tesla and SpaceX, has been a subject of a lot of controversies. However, his talent for gaining wealth is undeniable. As of November 2021, he’s worth $296.2 billion, achieving a significant lead over his biggest rival, Jeff Bezos.
27. Jeff Bezos’ net worth is 1.73 million times higher than average.
(Source: Forbes)
The founder of Amazon is worth $210.7 billion and definitely isn’t content on sitting on his wealth. He takes an active hand in running the company and is a part of the “billionaire space race” along with Elon Musk and Richard Branson.
28. Bill Gates’ net worth is 1.14 million times higher than average.
(Source: Forbes)
The founder of Microsoft has long been at or near the very top of the list and has been used as a living example of inequality in America and the rest of the world. He’s worth $139 billion and has mainly been focused on philanthropy since he stepped down as the head of the software giant.
29. Larry Ellison’s net worth is 1.14 million times higher than average.
(Source: Forbes)
Larry Ellison is the founder of Oracle and still serves as its chairman and CTO. More recently, he joined Tesla’s board and is now worth $128.2 billion.
30. Mark Zuckerberg’s net worth is 1.01 million times higher than average.
(Source: Forbes)
The founder of Facebook is the youngest entry on this list. Mark Zuckerberg is worth $123.5 billion, and considering his age, business acumen, and the tendency of wealth to accumulate, it’s likely he’ll reach even higher.
Wealth Inequality: Trends and Predictions
Are the rich getting richer in 2021? Yes!
Let’s take a look at the statistics:
31. The top 1% had their income soar 160% since 1979.
(Source: Economic Policy Institute)
While wages are constantly growing, they’re not growing in equal measure for everyone. The top 1% have had their income more than double in the last 40 years, while the “bottom” 90% of Americans had seen a growth of only 26%.
32. Inequality in household income, as measured by the Gini coefficient, increased by five points between 1944 and 2019.
(Source: United Nations World Income Inequality Database)
The Gini coefficient measures wealth distribution and income inequality in an economy. A zero-rating is indicative of a society where everyone earns the same and has the same level of wealth. The higher the number, the more unequal the society.
According to statistics related to the history of wealth inequality, America’s score increased from 43.6 in 1944 to 48.6 in 2019. This points to the growing disparity between top earners and the rest of the population.
33. The United States ranks second in terms of poverty rates in OECD countries.
(Source: OECD)
Compared to other OECD countries, the US doesn’t do quite as well in terms of those living below the poverty line. In this study, the poverty line is defined as households making half the median income for the country. Income and wealth inequality in the US makes this the pressing issue of our time.
34. Billionaire taxes are down 79% since 1980.
(Source: Institute for Policy Studies)
Since the 1980s, the taxes on the upper crust have dropped by a staggering 79%, which only served to exacerbate income inequality. Between 2006 and 2018, nearly 7% of America’s real increase in wealth went to the nation’s top 400 billionaires.
35. US Billionaires became 70% richer since the start of the COVID-19 pandemic.
(Source: Inequality)
America’s richest have only become richer during the pandemic. They collectively increased their wealth by $2.1 trillion, leading to a staggering increase in income disparity. The number of billionaires also increased, from 614 in March 2020 to 747 in November 2021.
36. One hundred of the country’s largest private landowners control 42.107 million acres of land.
(Source: The Land Report)
That’s a drop in the bucket compared to how much land the government owns, but it’s an interesting statistic regardless. That’s an average of 420,000 acres for each big landowner and a 50% increase in the last decade. Changing attitudes about the accumulation of capital and land as an asset class is thought to have fueled this growth.
This is contrasted with the fact that the majority of homeowners don’t own a single acre and that a large number of Americans don’t even own a home. The inequality is further compounded by the issue that homeownership has been either stagnant or in decline over the last decade.
In Conclusion
The wealth gap in America is clearly widening.
Inflationary pressures are eroding the power of the dollar.
The wealthy have an asset base that allows their earnings to outpace inflation.
Lower to middle-income families don’t have the same luxury. Consumer spending statistics indicate that lower-income families are under increasing pressure to provide basic essentials. As inflationary pressures continue to mount, these families are less able to improve their lot.
Unless something is done about this, we could see the American economy negatively impacted. The country has been doing well over the last few years, but the gains haven’t been filtered down to the workforce underpinning the economy. Models that contrast fairness vs equality show that America is failing on both counts.
If not addressed, this will lead to decreased spending and a concurrent growth slowdown. This, in turn, will result in job losses and further financial distress. Eventually, this negative growth will lead to another depression.
You now know a lot more about US income inequality statistics. Have you got ideas on how to redress the imbalances? Let us know in the comments.
FAQ
Wealth inequality is the disparity in net worth. Since wealth tends to accumulate at the top, this leads to ever wealth disparity and stratification of society. This leads to a reduction in economic opportunities for the lower classes, more social issues, and reduced market flexibility.
There are many reasons for income inequality increase in the US. Chief among them are stagnant wages for the middle and lower classes and increasingly lax taxation of the ultra-rich.
Globalization and outsourcing have further impacted low-impact workers, driving down the cost of labor.
The top 1% hold 32.27% of all household wealth in the US. This is the highest percentage that they’ve owned since 1962.
Researchers may use several statistical models to determine. The most commonly used metrics are:
- The Gini-coefficient — also referred to as the Gini Index
- The Hoover Index
- The Theil Index
These models combine a range of different factors, such as income, expenditure, demographics, asset ownership, geographic location, and so on, to allow for preparing more accurate US income inequality statistics.
See you around on SpendMeNot.com, everybody!
Sources
- Bureau of Labor Statistics
- Bureau of Labor Statistics
- Economic Policy Institute
- Federal Reserve
- Federal Reserve
- Federal Reserve Bank of St. Louis
- Forbes
- Inequality
- Institute for Policy Studies
- OECD
- RAND
- Social Security Online
- Statista
- Statista
- The Balance
- The Land Report
- United Nations World Income Inequality Database
- United States Census Bureau
- USA Today
- US Department of Labor
- White House
- Windfall
ABOUT AUTHOR
Fiona worked in the retail banking industry for 16 years. She felt that she could put her experience to good use in helping small businesses grow. Web writing was a great fit and sparked a new career for her. She believes that her flexible working schedule gives her more time to spend painting. She loves being at home all day with her schnauzers and her cat. For Fiona, it's furbaby Friday every day of the week.


Ed Kenerson
November 27, 2021 at 7:07 pm
You mentioned “inequity” a few times. I hope you’re not implying the country should foster “equality,” for there will always be rich folks who worked hard to earn what they have, as well as poor folks who never had the drive to earn what they could. Of course, there’s always some on either side, who used inappropriate and/or illegal behaviors here and there that shamefully widened the gap between the “haves” and the “have nots.” But, that’s never a reason for entitlement thinking and governmental grab-bag politics to give short cuts to anyone, including minorities. A sound society is never a socialist society, which inevitably will implode upon itself. Such folks want to feel good about being fair, but never rise to any significant potential because of incentive destroying policies. A strong society is not comprised of “takers,” but “workers,” who would rather refuse handouts than demand an arbitrary piece of “the pie.” The rich should be accountable to pay a sensible amount of taxes, of course, and the truly poor should receive a reasonable and compassionate tax adjustment. But, success policy #1 for everyone, regardless of one’s life situation, is: “If you’re unwilling to sow industriously, don’t expect to reap bountifully.” In the end, if one doesn’t ever achieve significant financial or material worth, he or she at least can have the joy of having made a responsible effort with personal honesty and integrity. No one deserves the benefits of economic freedom without the pressing hard against the boundaries of contentment and effortless dreaming. I hope you would agree that there are no loafers on the capitalism train, though there are, from time to time, a fair number of self-absorbed complainers.