US Inflation Forecasts and Statistics to Be Aware of in 2023
Last Updated: March 10, 2023
Inflation is a sustained increase in the general prices of goods and services in any economy. The more the general price of goods and services increases, the less you can buy for the same amount of money.
US inflation stats indicate that the inflation rate in the US generally stays between 1.5% and 2.5%. We’ll try to determine what that means and how it will change in the future.
Here are some US inflation forecasts and statistics to get you started:
Fascinating Facts about US Inflation
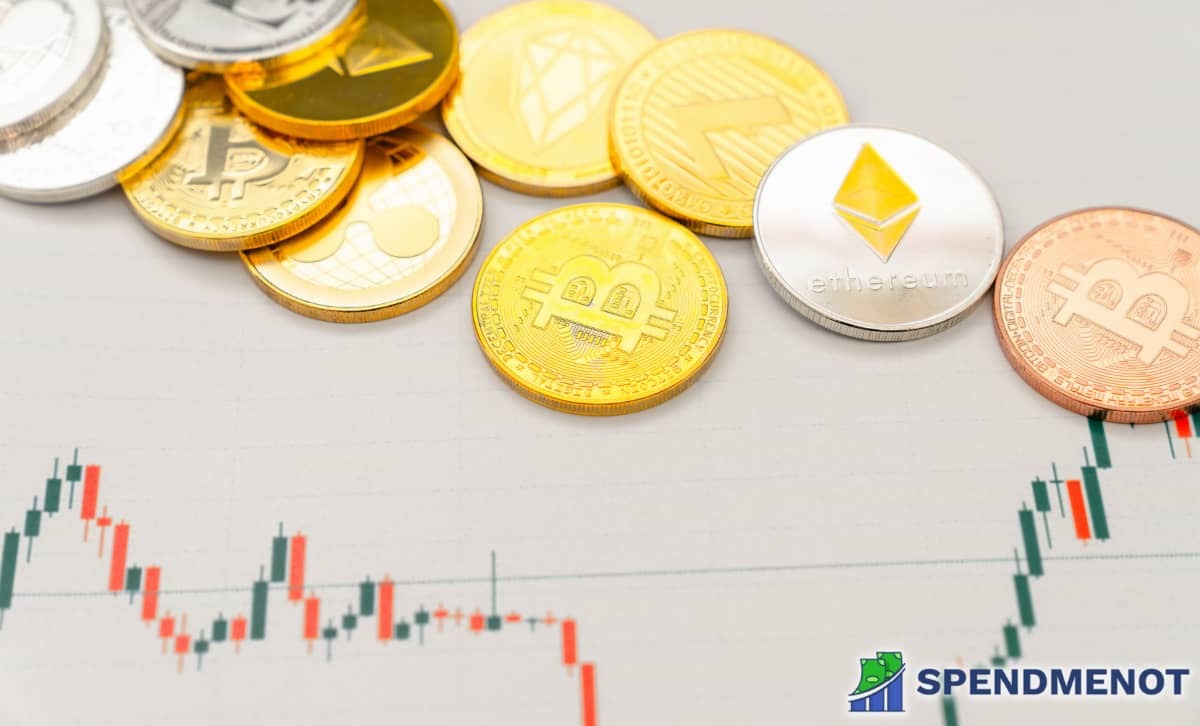
- The average rate of inflation in the US is 3.1%
- The medical inflation rate was at 4.11% in 2020
- The food inflation rate came down to 2.4%
- The lowest ever CPI housing utilities rate was in 1967 at 30.50 points
- The GDP growth rate for Q1 2021 was 6.4%
- US headline rate of inflation varied from 0.1% to 2.3% in 2020
Since the outbreak of the COVID-19 pandemic, financial specialists all over the have been predicting upcoming inflation. How much did the Coronavirus affect the global economy? It remains to be seen.
Here we go:
US Inflation Rate Forecast
Along with unemployment and GDP, inflation is one of the best indicators of a country’s economic health. Let’s see what the future holds according to inflation rate projections.
1. The projected inflation rate for 2021 is 2.4%.
(Source: Knoema)
The Federal Open Market Committee (FOMC) has made its forecast that the United States’ inflation rate for 2021 will average at around 2.4%. In 2023, it is set to decrease to 2.1%. Most other agencies predict a gradual drop in inflation over the upcoming years.
2. The US CPI rate climbed to 4.2% year-on-year in April 2021.
(Source: US Bureau of Labor Statistics)
This is the fastest increase since 2008. US inflation rate statistics show that energy prices are the largest culprit, as they increased by 25% in a year — gasoline alone jumped by almost 50%, while fuel oil increased by 37.3%.
Federal Reserve policymakers and economists are dismissing the sudden increases as transitory and brought on by the COVID-19 pandemic. The inflation is expected to settle down by the end of the year to around 2%.
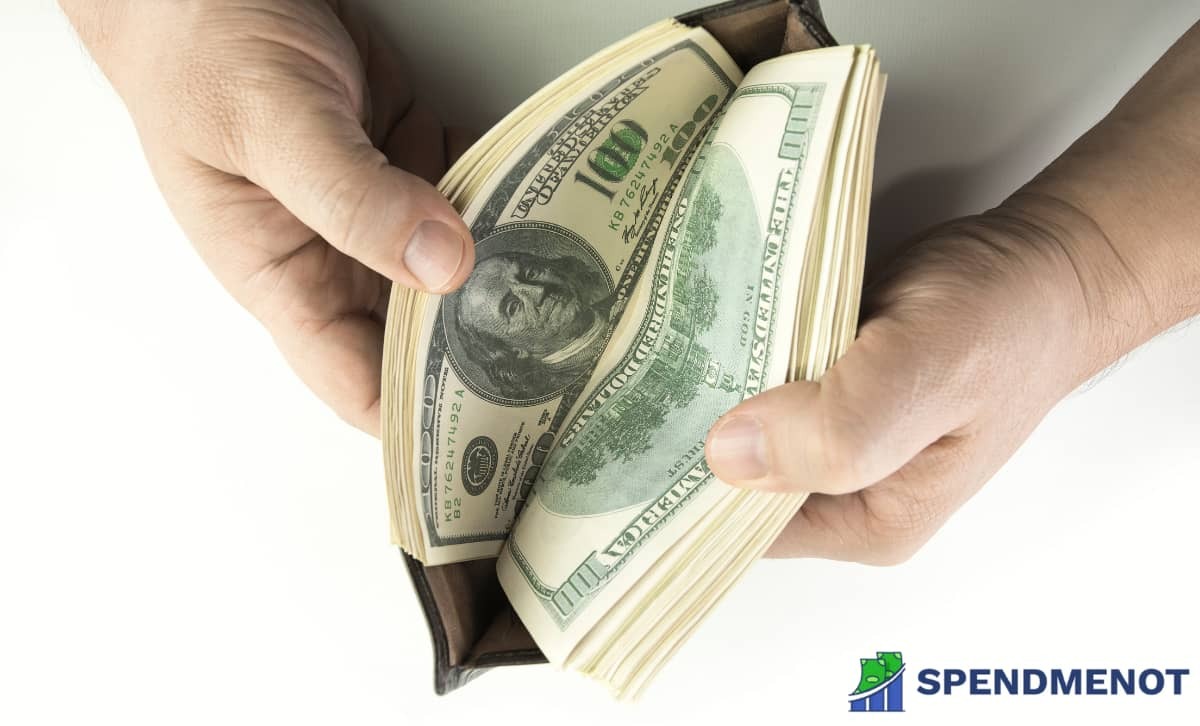
3. From 1800-2021, the US dollar has had an average inflation rate Of 1.39% per year.
(Source: CPI Inflation Calculator)
Recently, the Bureau of Labor Statistics released a consumer price index. It shows that prices in 2021 are estimated to be 2,019.48% higher than in 1800.
It seems that the real value of the currency has steadily increased. US dollar inflation statistics show that $1 during the 1800s had the same purchasing power as 20.39 of today’s dollars.
4. The average rate of inflation is 3.1%.
(Source: Inflation Data)
This means that the overall cost of living doubles every two decades, which can greatly impact the consumers’ spending power. The average annual inflation rate needs to go down, or consumers will feel major effects.
This means that we’ve been faced with total inflation of 2,555% since 1913.
Current CPI Rate in the USA
The Consumer Price Index (CPI) is used to measure the cost of consumer goods and services, such as food, transportation, and medical care. When CPI changes, it’s assumed that the living standard also changes. It’s one of the most frequently used metrics that can be used to identify the standard inflation and deflation rate.
5. The cost of living has remained At 1.4% in 2020.
(Source: US Bureau of Labor Statistics)
Food cost increased at a rate of 3.9% both for food at home and away from home — this is the largest year-over-year increase in food at home increase since 2011. Meat products had the highest inflation rate at 4.6%, and fruits and vegetables had the lowest rate at 3.2%.
6. US target inflation rate is 2%.
(Source: Forbes)
The Federal Reserve has set the target inflation rate at 2%, but it has remained mostly below that during the last decade. Despite the recent upticks, it is expected to return to normal by the end of the year, and normal investors and employees are advised to keep on doing what they were doing until now. That means saving 10–15% of income in the retirement plan; after all, the rise in inflation isn’t that high.
7. The US higher education price inflation rate increased by 1.9% in 2020.
(Source: Inside Higher Ed)
That means it’s significantly lower than the 3% in the previous year. The greatest increase was in paying service employees, which increased 4%. Faculty salaries rose 2.7%, while clerical costs rose by 3.2%
The amount of money spent on utilities and supplies and materials dropped for the first time in four years. Supplies and materials costs were reduced by 3.5%, while utility costs plummeted by 15.7% — the likeliest cause being reduced facility use due to the pandemic.
And now let’s see what the global inflation rate is in 2021:
8. The standard inflation rate for the world is 3.5%.
(Source: IMF)
In 2021, the projected worldwide standard inflation rate is around 3.5%. In comparison, the USA’s average annual is expected to be around 2.3% — significantly lower.
The worldwide inflation rate should drop to 3.2% in 2022, while the US inflation rate should increase to 2.4%.
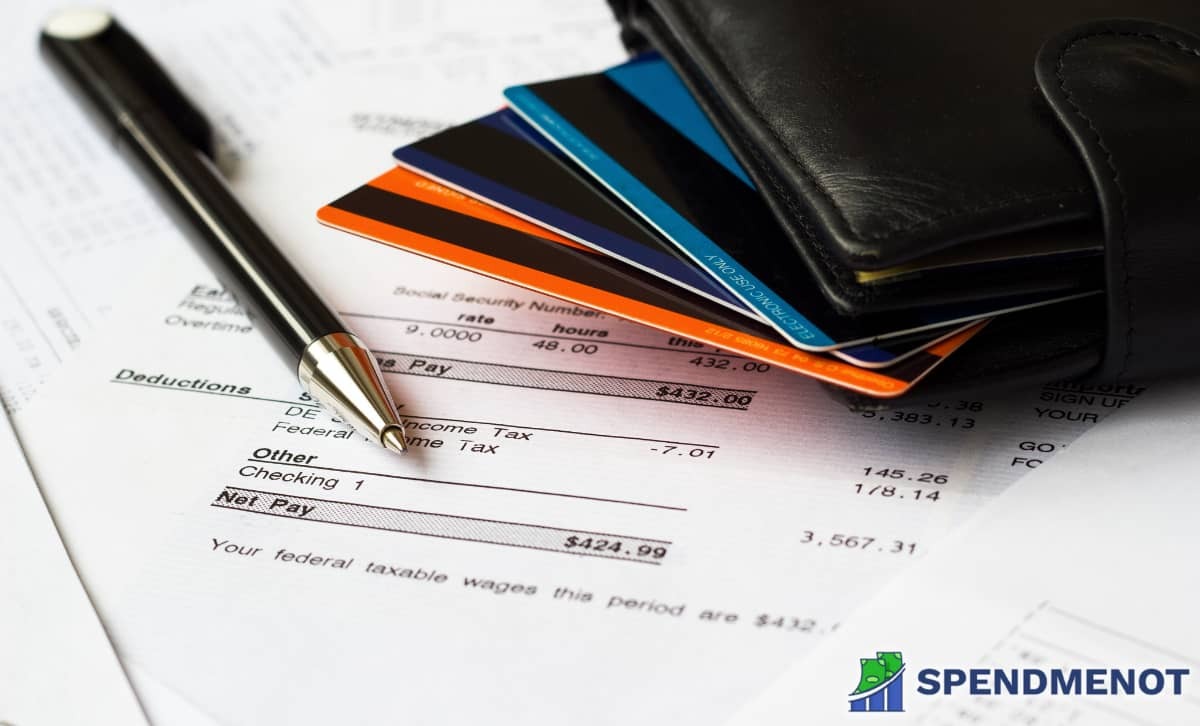
US Wage Inflation Statistics
Wage inflation is another important metric that allows us to glean some information on how the economy as a whole is doing.
9. Wages rose year-over-year 0.3% in January 2021.
(Source: Economic Policy Institute)
Wages were keeping up with inflation until the end of 2019. The onset of the COVID-19 pandemic caused a large spike in wage growth. However, the main cause of that increase was massive layoffs that disproportionately hit low-paid workers.
Since then, the data has shown that actual wages have become practically stagnant. When it comes to wage inflation vs price inflation, wages need to rise with the cost of living; otherwise, the living standards can drop significantly.
10. By 2025, the $15 minimum wage is expected to grow to $16.28.
(Source: EPI)
While raising the minimum wage can cause an inflation increase, it also increases the spending power of a large portion of the working population.
Despite this, actually raising the minimum wage is not an easy process. The last time the current minimum wage was increased was in 2009 to $7.25 from $6.55.
11. The average medical inflation rate was 4.11% in 2020.
(Source: YCharts)
The medical inflation rate is an important factor in the US consumer price index, as it represents a major expenditure. Health care costs and spending have significantly increased in 2019 and have only dropped below 2% at the end of 2020.
When we look at historical data, it’s clear that health care costs have never stopped climbing, and the steep upward rise started in the 70s.
US Historical Inflation Rate
By looking at how inflation behaved in the past, we can predict how it will behave in the future. In fact, a large portion of US inflation forecasts and statistics is grounded in information gleaned from the past. This insight allows for better planning of the economy, which improves stability.
12. The average inflation rate since 2000 has been 2.27%.
(Source: Statista)
From 2000 to 2020, the highest inflation rate was in 2008 at 3.8%.
The lowest was -0.4% in 2009. The US inflation from 2009 to 2019 was 1.5%. The average inflation rate of the last ten years has been relatively lower due to the policies set by the government.
13. The highest inflation rate in US history was 29.78%.
(Source: Investopedia)
Aside from a few exceptions, the US inflation rate was mostly steady at 2%-3%. That’s nowhere near close to the peaks it could reach, though.
The highest inflation rate in the country was just shy of 30%. This was way back in 1778, two years after the United States of America was founded.
14. The cumulative inflation rate in the US is 2,579.79% from 1914-2021.
(Source: SmartAsset)
$1 in 1914 is worth $26.8 in 2021. The cumulative inflation rate is 2,579.79%, and the average annual rate is 3.23%.
Historic inflation information on basic goods shows a serious spike in the cost of food. While the growth was relatively constant, 1.6%–1.8% in the previous years, in 2020, the inflation rate more than doubled. Used cars and trucks have also skyrocketed in cost, from previously low or even negative inflation to the shocking 10%. Energy, gasoline, and airline fares, on the other hand, have dropped by 7%, 15.2%, and 18.4%, respectively.
15. Monthly US Inflation Rate during the Great Depression reached -2.05%.
(Source: Inflation Data)
Throughout 1930, prices dropped half a percent or more each month. In 1931, this increased to 1% or more, reaching 2.05% in January of 1932.
The Great Depression of 1930-1939 began on September 4th, 1929, when the stock market crashed. The crash of the stock market caused panic among investors, which led to a liquidity crisis. Banks started becoming averse to any risk and stopped giving out loans. By 1930, the stock market had rebounded, but by then, it was too late. The deflation continued until March 1933.
16. The Civil War cost around $22 trillion in today’s dollars.
(Source: MeasuringWorth)
The Civil War was one of the bloodiest conflicts in US history.
Of course, it was also incredibly costly. By analyzing US inflation stats and calculating the inflation via GDP deflator, we concluded that it cost the country $139 billion in today’s currency.
However, due to the sheer scope of the conflict, the best way to calculate the cost of the war and the post-war repercussions is by using the share of GDP. That way, we get to the number of $6.7 trillion in 1860 dollars.
US Consumer Price Index Stats
The US GDP, inflation rate, and unemployment rates need to be looked at together to get a comprehensive account of the economic health of the country. US inflation forecasts and statistics clearly indicate that increasing GDP doesn’t mean much if unemployment is growing as well and inflation is sapping the buying power of the populace.
17. Food inflation dropped to 2.4% from 3.5% in 2020.
(Source: Trading Economics)
Medical care services also dropped from their 2020 levels to 2.2%. The monthly consumer core inflation increased to 0.9% in April, the highest level since 1996.
18. The GDP annual growth rate for Q1 2021 was 6.4%.
(Source: Bureau of Economic Analysis)
This was a significant increase from the fourth quarter of 2020 when it was 4.3%. The increase reflects an increase in personal consumption expenditures, federal government spending. However, it was offset by an increase in imports and decreases in exports and private inventory investments.
19. The US inflation, GDP deflator value for 2019 was 1.942%.
(Source: World Bank)
In 2018, this value was 2.436%. In comparison, the world’s inflation GDP deflator for 2018 was 2.324% and 2.762% in 2017.
As measured by the GDP deflator value, inflation represents the price change rate of the economy as a whole. This includes the price level of all-new, final, and domestically produced goods and services in the country over one year.
20. US headline rate of inflation varied from 0.1% to 2.3% in 2020.
(Source: FX Street)
It’s no surprise that the year of the pandemic brought such high variance in what’s meant to be a stable metric. The lockdown of the US economy in March and April brought down annual CPI from 2.3% in February and 1.5% in March to a low of 0.1% In May.
In the second half of the year, things stabilized somewhat. The CPI has averaged 1.25% with a range of 1% to 1.4%. However, after July’s low, the variation has further narrowed to between 1.2% and 1.4%.
21. CPI housing utilities reached an all-time high of 277.26 points in April of 2021.
(Source: Trading Economics)
From 1967 to 2021, the average value was 153.88 points. In April of 2021, it reached an all-time high of 277.26 points. This shows that the biggest fear of millennials of never being able to afford housing on the current wage rate is coming true. Housing is getting more and more expensive with every passing year. The lowest ever rate was in 1967 at 30.50 points.
22. The lowest CPI housing utilities rate of 2020 was in January.
(Source: Trading Economics)
In January 2020, the consumer price index for housing utilities reached 269.468 points. Excluding a minor dip at the start of the pandemic, It grew rapidly until the end of the year when it reached 273.684 points.
23. The lowest CPI transportation value for 2020 was 191.419 in May.
(Source: Trading Economics)
The year began at a high of 208.284 in January and ended at 203.56 points in December. May was the lowest ever in the past five years, reaching a bottom of 191.419 points. Comparing that to the low of below 50 points in the 1960s, we can see that the price of transportation has increased significantly.
24. 2021 started with a low Fed funds rate of 0.25%.
(Source: Trading Economics)
Since the economic recovery is far from complete and that PCE inflation could move above 2% due to the transitory effects of the pandemic. The current target interest rates are expected to stay low, between 0% and 0.25%, until the situation stabilizes.
In Conclusion
That ends this set of interesting inflation facts.
We hope this was illuminating and that you’ve learned more than you knew going in.
These US inflation forecasts and statistics may not be particularly rosy, considering the upheaval caused by the COVID-19 pandemic, but it seems that we’re on our way to recovery.
Inflation is an inextricable part of how our society functions. In fact, it’s unavoidable for a healthy and growing economy.
However, if it’s left unchecked, it can have devastating consequences. That’s why it’s vital to know how it affects our society and be prepared for the future.
See you around on SpendMeNot, everyone.
Sources
- Bureau of Economic Analysis
- CPI Inflation Calculator
- Economic Policy Institute
- EPI
- Forbes
- FX Street
- IMF
- Inflation Data
- Inflation Data
- Inside Higher Ed
- Investopedia
- Knoema
- MeasuringWorth
- SmartAsset
- Statista
- Trading Economics
- Trading Economics
- Trading Economics
- Trading Economics
- US Bureau of Labor Statistics
- US Bureau of Labor Statistics
- World Bank
- YCharts